
Congratulations on completing your AAT Level 3 Diploma in Accounting! This significant achievement has equipped you with a robust set of skills, from advanced bookkeeping...
Your First Look at the Balance Sheet
Before you start crunching complex ratios, it is vital to get a feel for what a balance sheet actually represents. It is not a video of the company’s financial year; it is a photograph taken on a specific day. Nailing this concept is a foundational skill for anyone working in bookkeeping, final accounts, or business analysis.
The whole structure is built on that simple but powerful formula: what you have must equal what you owe plus the owners’ stake. Let’s break down the three core pillars you will find on every single balance sheet.
Here is a quick rundown of what each component means for a business.
The Three Pillars of a Balance Sheet
| Component | What It Represents | Common UK Examples |
|---|---|---|
| Assets | The resources a business owns that have economic value. | Cash in the bank, office equipment, buildings, stock (inventory), money owed by customers (trade debtors). |
| Liabilities | What the business owes to other parties. | Bank loans, supplier invoices (trade creditors), VAT owed to HMRC, outstanding bills. |
| Equity | What is left for the owners after all liabilities have been paid. | Share capital (money invested by owners), retained earnings (profits kept in the business). |
This table gives you a solid reference point for the key terms you will encounter as we dig deeper. Each section tells a different part of the company’s story.
This infographic brings the fundamental relationship between these three pillars to life.
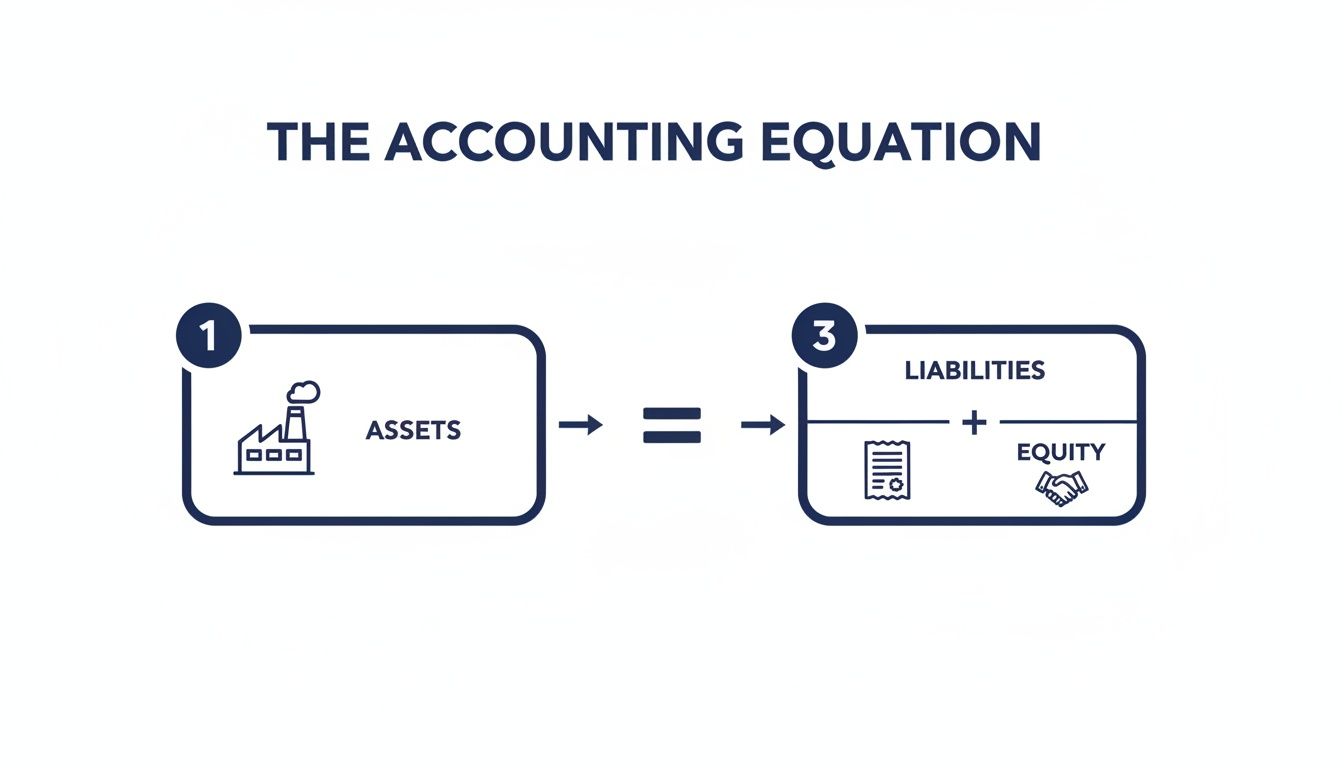
As you can see, a company’s assets are funded in one of two ways: either by taking on debt (liabilities) or through money from its owners (equity). There are no other options.
Why the Balance Sheet Must Always Balance
So, why does this equation have to balance? It all comes down to the principles of double-entry bookkeeping, a system where every single transaction has two equal and opposite effects.
For instance, when a company buys a new laptop (an asset), the cash in its bank account (another asset) goes down to pay for it. Or, if it is bought on credit, a loan (a liability) goes up. Either way, the equation stays in perfect equilibrium. Our bookkeeping and VAT training explores this principle in practical detail.
The balance sheet does not just show numbers; it tells a story about a company’s structure, solvency, and investment. It reveals how management has chosen to finance its operations—through debt or equity—and how efficiently it uses those resources.
Grasping this fundamental principle is what allows you to move from just looking at numbers to actually analysing them. It is a key skill for aspiring accounts assistants and business analysts. For a more detailed breakdown of the components, this guide on how to read a balance sheet like a pro investor provides some excellent insights.
With this framework in mind, you are ready to start exploring the individual sections of the balance sheet line by line.
A Guided Tour of the Assets Section

The assets section is where you get a clear look at everything a company owns that holds genuine economic value. Think of it as the business’s toolkit—all the resources it uses to operate and generate revenue. Learning to read this part of the balance sheet is a fundamental skill taught in any quality accounts assistant course because it tells a powerful story about a company’s operational strength.
Assets are almost always listed in order of liquidity. In simple terms, that is how quickly they can be turned into cash. This is not just a random convention; it is designed to help you immediately assess how easily the company could access funds if it needed to. The list is neatly split into two main categories: current and non-current assets.
Understanding Current Assets
Current assets are the resources a company expects to use up or convert into cash within one year. They represent the lifeblood of day-to-day operations and are a key indicator of short-term financial health. These are the line items you will be scrutinising when you put skills from bookkeeping and VAT training into practice.
You will almost always find these three major types of current assets:
- Cash and Cash Equivalents: This is the most liquid asset there is. It includes all the money sitting in the company’s bank accounts plus any short-term investments that can be accessed almost instantly.
- Accounts Receivable: Also known as trade debtors, this is the money owed to the company by its customers for goods or services they have already received. A high accounts receivable figure could signal strong sales, but it might also be a warning that the business is struggling to collect payments.
- Inventory: This is the value of raw materials, work-in-progress, and finished goods the company has on hand, ready to sell. Analysing inventory is a critical skill for any aspiring business analyst.
Let’s imagine a fictional UK tech start-up, “Innovate UK Ltd.” Their balance sheet shows an inventory value of £200,000. On its own, that number does not tell us much. But what if last year it was only £50,000? That sharp increase forces us to ask some critical questions. Is it a sign of booming demand, with the company stocking up for a flood of new orders? Or is it a red flag that products just are not selling?
A sharp increase in inventory relative to sales can be a warning sign. It might indicate that a company is overproducing or that demand has fallen, tying up valuable cash in unsold goods that could become obsolete.
This is exactly the kind of analysis that transforms raw data into strategic insight—a core competency developed in final accounts training. You are no longer just reading a number; you are investigating the story behind it.
Exploring Non-Current Assets
Moving further down the balance sheet, you will find non-current (or fixed) assets. These are the long-term resources that the business does not expect to convert into cash within a year. They form the very backbone of a company’s operations and its capacity for future growth.
Key examples of non-current assets include:
- Property, Plant, and Equipment (PP&E): This covers the big-ticket physical items like land, buildings, machinery, vehicles, and office furniture. These are the tangible assets essential for the business to function.
- Long-Term Investments: This could be investments in other companies or financial assets that the business plans to hold for more than a year.
- Intangible Assets: These are assets that you cannot physically touch but still provide enormous value. They are becoming increasingly important in our modern, knowledge-based economy.
The Importance of Intangible Assets
Intangible assets are often overlooked by newcomers but can be a company’s most valuable possessions. Understanding them is crucial, especially when you are analysing businesses in the tech, data, or creative industries.
Here is a quick breakdown of common intangibles:
- Goodwill: This usually appears after an acquisition, when one company buys another for more than the fair market value of its net assets. It represents the value of things like brand reputation, customer loyalty, and intellectual property.
- Patents and Trademarks: These provide legal protection for inventions and brand identities, giving a company a serious competitive edge.
- Copyrights: These protect original creative works, like software code or marketing materials.
For our start-up, “Innovate UK Ltd.,” a patent for a new software algorithm could easily be its most significant asset, even if its physical equipment is minimal. A skilled data analyst would need to know how to value such assets to get a true picture of the company’s potential. It is this ability to look beyond the physical and evaluate these intangibles that separates a basic bookkeeper from a sharp financial analyst.
Decoding Liabilities and Equity
We have looked at what a company owns. Now, let’s flip the coin and look at what it owes. This half of the balance sheet is just as telling because it reveals exactly how the business is paying for everything.
Getting a handle on liabilities and equity is non-negotiable for any aspiring bookkeeper or business analyst. It is how you assess a company’s financial structure and, ultimately, its stability.
Simply put, liabilities are the company’s financial obligations—the bills and debts it needs to pay. Just like assets, they are split by timing. This helps you quickly see what needs paying now versus what is a longer-term commitment.
Understanding Current Liabilities
Current liabilities are the debts that have to be settled within one year. Think of them as the company’s short-term financial to-do list.
Effectively managing these is a core skill taught in practical bookkeeping and VAT courses, because letting them get out of hand is a fast track to a cash flow crisis.
You will typically see items like:
- Accounts Payable (Trade Creditors): The money owed to suppliers for goods or services bought on credit.
- Short-Term Loans: Any loan payment or portion of a loan that is due within the next 12 months.
- VAT Payable: The Value Added Tax a business has collected for HMRC but has not handed over yet. A critical line item for any UK business.
- Accrued Expenses: Expenses that have built up but have not been invoiced, like salaries for the last few days of the month.
If current liabilities are creeping up and getting close to the value of current assets, it is a potential red flag. It might suggest the business could struggle to meet its immediate bills, a metric any good accounts assistant learns to watch like a hawk.
Examining Non-Current Liabilities
Look further down the balance sheet and you will find non-current liabilities. These are the long-term financial promises that are not due for at least another year. They often reflect big strategic decisions about funding growth and major purchases.
Common non-current liabilities include:
- Long-Term Bank Loans: Money borrowed from a bank with repayment terms stretching beyond one year.
- Bonds Payable: If a company has issued bonds to raise money from investors, this is where that debt sits.
- Deferred Tax Liabilities: Taxes that are definitely owed but will not actually be paid until a future date.
A sharp data analyst will look at the mix between current and non-current debt. Is the business using short-term credit to pay for long-term assets, like a new factory? That kind of mismatch can cause serious trouble down the line.
Shareholder’s equity is not a pool of cash waiting to be spent. It is the accounting measure of the owners’ claim on the company’s assets after all debts have been settled. It represents the net worth of the business from an accounting perspective.
Demystifying Shareholder’s Equity
Finally, we get to shareholder’s equity (sometimes called owner’s equity). This number shows what would theoretically be left for shareholders if the company sold off all its assets and paid back every single one of its debts. It is the owners’ residual slice of the pie.
Equity is made up of two main ingredients:
- Share Capital: The total cash and other assets that shareholders have put into the business in exchange for their shares.
- Retained Earnings: This is the running total of all the profit the company has ever made, minus any dividends it has paid out to shareholders. It is the profit that has been reinvested back into the business.
A history of steadily growing retained earnings is a classic sign of a healthy, profitable company. It shows that the business is making money and is confident enough to plough it back in to fuel more growth. Understanding these trends is a vital part of the skillset you would develop in final accounts training.
To see these concepts on a massive scale, you only need to look at national balance sheets. Digging into historical UK sectoral balance sheets from 1957-1986 shows modern accountants how financial assets and liabilities shift over decades. More recently, in 2021, the UK’s national balance sheet reported a financial net worth of negative £424.2 billion—a figure that was revised upwards after better data on bond liabilities and pensions became available. It is a powerful reminder that even at a national level, what is owed can significantly outweigh financial assets. You can find more of these insights in the historical financial accounts from the Office for National Statistics.
Bringing It All Together With Financial Ratios
A balance sheet on its own is just a list of numbers frozen in time. Its real power comes alive when you start to analyse it, turning that static statement into a dynamic tool for making smart business decisions. This is where financial ratios come into play. They let you look beyond the surface, measure performance, and start asking the right questions about a company’s financial health.
For anyone aiming for a career as a data analyst or business analyst, getting to grips with ratio analysis is non-negotiable. It is the craft of turning raw data into genuine intelligence. Ratios give you context, helping you compare a company’s performance against its own history or stack it up against competitors in the same industry.
Checking Short-Term Health: The Current Ratio
First things first: can this business pay its bills in the near future? The Current Ratio is your go-to metric for this vital health check. It quickly tells you if a company can cover its short-term debts with its short-term assets.
The formula is simple:
Current Ratio = Current Assets / Current Liabilities
A ratio of 2:1 is often seen as a healthy benchmark. It suggests the company has twice the value in current assets as it owes in current liabilities. On the flip side, a ratio below 1:1 could be a major red flag, hinting at potential cash flow problems down the line.
Let’s imagine a UK retail business, “Urban Threads Ltd.”, with the following figures:
- Current Assets: £100,000 (cash, inventory, accounts receivable)
- Current Liabilities: £50,000 (supplier invoices, VAT payable)
Urban Threads’ Current Ratio would be £100,000 / £50,000 = 2.0. This looks solid. They appear to have enough liquid resources on hand to comfortably meet their obligations over the next year. This is the kind of immediate check an accounts assistant would perform to assess the company’s day-to-day stability.
Gauging Long-Term Risk: The Debt-to-Equity Ratio
While the Current Ratio is all about the here and now, the Debt-to-Equity (D/E) Ratio gives you a clear picture of a company’s long-term risk profile. It shows you how much the business relies on debt versus its owners’ capital to finance its growth.
Here is the calculation:
Debt-to-Equity Ratio = Total Liabilities / Shareholder’s Equity
A high D/E ratio suggests a company is aggressive, funding its expansion with a lot of debt, which can be risky. A lower ratio means the business relies more on equity from its owners. There is no single “perfect” ratio here; it varies massively by industry. A manufacturing firm will naturally have a higher ratio than a small service-based business, for example.
Let’s go back to Urban Threads Ltd. and look at their total figures:
- Total Liabilities: £150,000 (including a long-term bank loan)
- Shareholder’s Equity: £100,000
Their Debt-to-Equity Ratio is £150,000 / £100,000 = 1.5. This tells us that for every £1 of equity, the company has £1.50 of debt. Understanding this balance is a crucial skill taught in final accounts training, as it directly shapes financial strategy. To get the full picture of a company’s health, it is essential to know how to analyze financial statements in more detail.
Measuring Efficiency: The Return on Assets Ratio
Finally, you need to know how well the company is using everything it owns to actually make money. That is what the Return on Assets (ROA) ratio is for. It reveals how efficiently management is using its asset base to generate profit.
The formula is:
Return on Assets = Net Income / Total Assets
A higher ROA percentage is always better, as it shows the company is squeezing more profit out of every pound of assets it controls. It is a key performance indicator that a business analyst would track closely to evaluate operational effectiveness.
Let’s say Urban Threads Ltd. had a net income of £25,000 for the year and total assets of £250,000.
Their ROA would be £25,000 / £250,000 = 0.10, or 10%. In simple terms, for every £1 of assets the company holds, it generated 10p of profit. Comparing this figure to previous years or to competitors would instantly show whether their efficiency is improving or falling behind.
Ratios are not just calculations; they are the start of a conversation. A single ratio in isolation means little. The real insight comes from comparing them over time and against industry benchmarks to understand the story behind the numbers.
To help you keep these essential ratios straight, here is a quick reference table.
Key Balance Sheet Ratios at a Glance
This table breaks down the most important financial ratios, their formulas, and what they reveal about a company’s financial health.
| Ratio Name | Formula | What It Tells You |
|---|---|---|
| Current Ratio | Current Assets / Current Liabilities | Measures short-term liquidity and the ability to pay immediate debts. |
| Debt-to-Equity Ratio | Total Liabilities / Shareholder’s Equity | Evaluates long-term financial risk and reliance on debt financing. |
| Return on Assets (ROA) | Net Income / Total Assets | Shows how efficiently the company is using its assets to generate profit. |
By using these three key ratios, you are no longer just reading a balance sheet—you are actively interpreting it. This is the exact analytical skill employers are looking for in candidates who have completed practical training in accountancy and data analysis.
Analysing Trends and Spotting Red Flags
While ratios are a brilliant diagnostic tool, a single balance sheet only ever gives you a snapshot in time. It is just one frame of a much larger story.
To truly understand a company’s financial journey—and to spot trouble before it spirals into a crisis—you need to compare these snapshots over several periods. This is where trend analysis becomes an absolutely essential skill for any ambitious accounts assistant or business analyst.
Two simple but incredibly effective techniques will get you there: horizontal analysis and vertical analysis. Mastering them is the difference between simply reading a balance sheet and being able to interpret its story.
Horizontal Analysis: Looking Across Time
Think of horizontal analysis (also known as trend analysis) as laying out a series of photographs to see how something has changed over the years. You are comparing line items from balance sheets across consecutive periods—usually quarters or years.
The goal here is to track the direction and, just as importantly, the speed of change for key accounts like cash, debt, and inventory.
The calculation itself is straightforward:
Percentage Change = ((Current Year Figure – Previous Year Figure) / Previous Year Figure) x 100
By running this calculation for each line item, you can instantly see which parts of the business are growing, which are shrinking, and—critically—which are changing at an alarming rate. It is a core skill we drill down on in final accounts training because it reveals the narrative behind the numbers.
Vertical Analysis: Comparing Proportions
Vertical analysis, or common-size analysis, flips the perspective. Instead of comparing figures over time, it expresses each line item as a percentage of a single base figure from the same period. For the balance sheet, that base is always Total Assets.
For instance, cash might be 10% of total assets, inventory 25%, and property 40%. This method is fantastic because it lets you see the company’s financial structure at a glance.
Even better, it makes comparing businesses of different sizes incredibly easy. A small local manufacturing firm and a huge multinational can be compared directly because you are looking at proportions, not absolute pounds and pence.
Trend analysis is about finding the outliers. A steady 5% increase in inventory year-on-year is expected growth. A sudden 50% jump in one year is a red flag that demands immediate investigation.
A UK Manufacturing Firm: Case Study
Let’s put this into practice. We will look at a simplified example of a UK manufacturing firm, “Precision Parts Ltd.,” over three years. This is the kind of analysis someone in an advanced payroll or accounting role needs to perform to understand the wider financial health of their business.
| Account | Year 1 (£) | Year 2 (£) | Year 3 (£) |
|---|---|---|---|
| Cash | 50,000 | 30,000 | 15,000 |
| Inventory | 100,000 | 150,000 | 250,000 |
| Total Assets | 500,000 | 550,000 | 600,000 |
| Short-Term Debt | 75,000 | 100,000 | 180,000 |
Spotting the Red Flags
A quick horizontal analysis brings some worrying trends to light:
- Dwindling Cash: Cash reserves have nosedived from £50,000 to just £15,000 in two years. This is a classic symptom of a liquidity squeeze.
- Bloated Inventory: Inventory has ballooned by a massive 150% (from £100k to £250k), while total assets only crept up by 20%. This strongly suggests Precision Parts is struggling to sell its products.
- Spiralling Debt: Short-term debt has more than doubled. It looks like the company is borrowing heavily just to fund its day-to-day operations and all that unsold stock.
This type of detailed examination showcases some of the hands-on skills you gain from accounts assistant training, moving you beyond simple data entry into meaningful financial investigation.
Understanding trends on a much larger scale also sharpens your skills. Take the Bank of England’s data as a massive real-world example. Between 2006 and 2025, its balance sheet averaged an incredible £343,428 million. It hit an all-time high of £1,119,387 million in December 2021 during the quantitative easing period.
To really put things in perspective, the Bank’s total assets were equivalent to 22.60% of the UK’s nominal GDP back in 2016, showing just how massive national financial structures can be. You can dive deeper into these large-scale trends by exploring the UK’s central bank balance sheet data.
Putting Your Balance Sheet Skills Into Practice

Knowing the theory is one thing, but applying it is what truly builds a career in finance. This is the moment your ability to read a balance sheet shifts from an academic exercise to a powerful, practical skill that UK employers are actively looking for. The good news is, modern tools and targeted training make this jump much smoother than you might think.
In any modern accounting role, from bookkeeping to a business analyst position, you will be working with software. Platforms like Xero, Sage, and QuickBooks are the industry standard for a reason; they automate much of the heavy lifting in creating financial statements. Our certified training focuses heavily on these tools, making sure you can not only generate these reports but, more importantly, make sense of the story the data is telling you.
Get Hands-On With a Practice Exercise
To bridge that gap between theory and real-world application, let’s get our hands dirty with a guided exercise. We have put together a downloadable Excel template with a practice balance sheet for a fictional UK-based digital marketing agency, “Bright Spark Media Ltd.”
Your Task:
- Download the Template: Grab the Excel file with Bright Spark Media’s balance sheet for the last two years.
- Calculate Key Ratios: Using the formulas we covered earlier, work out the Current Ratio and the Debt-to-Equity Ratio for both years.
- Perform a Vertical Analysis: For the most recent year, express Cash, Accounts Receivable, and Total Liabilities as a percentage of Total Assets.
This exercise is not just for show—it mirrors the exact kind of tasks you would handle in an accounts assistant role. It forces you to get comfortable with the numbers, cementing your understanding of how these metrics reveal a company’s financial health. Can the company cover its short-term debts? Is its borrowing sustainable? These are the questions you can now confidently answer.
Turning Knowledge Into Your Next Job
Once you are comfortable analysing a balance sheet, the final piece of the puzzle is showing employers you have this valuable skill. This is about more than just listing a qualification on your CV; it is about being able to talk about your expertise in a way that resonates with hiring managers.
For instance, when an interviewer asks about your analytical skills, you can leave the generic answers behind. You can say something like:
“In my training, I learned not just to prepare financial statements but to analyse them. For example, I can perform horizontal analysis to spot trends in liquidity over time or use a vertical analysis to benchmark a company’s asset structure against its competitors. This helps me identify potential red flags, like rapidly increasing inventory or dwindling cash reserves.”
That kind of specific, confident answer shows a level of insight that immediately sets you apart. It demonstrates you can provide real value, which is a core focus of our comprehensive final accounts training. We bake this career-focused approach into all our courses, from advanced payroll to data analyst training, and provide dedicated recruitment support to help you frame your new skills effectively.
By mastering the balance sheet, you are equipping yourself with the fundamental language of business. You gain the ability to assess stability, measure performance, and contribute to strategic financial decisions—making you a highly desirable candidate in the competitive UK job market.

