
So, you're thinking about becoming ACCA qualified. It’s a fantastic move. This isn't just another qualification; it's a globally recognised badge of expertise that shows...
What Is Financial Forecasting and Why Does It Matter?

Imagine trying to navigate a ship across the Atlantic without a weather report. You might get lucky, or you might sail straight into a storm. Financial forecasting is that weather report for your business. It won’t control the economic seas, but it gives you a clear idea of what’s on the horizon. This lets you prepare for sunny spells of high revenue or brace for potential cash flow storms.
The process involves a deep dive into historical data. This means poring over past sales figures, expense reports, and cash flow statements to spot patterns and trends. But it doesn’t stop there. A solid forecast blends this internal history with crucial external factors. These include economic shifts, industry trends, and what your competitors are up to. The result is a credible projection of future revenue, expenses, and, ultimately, profit.
For anyone aiming for a role in finance, from an accounts assistant to a business analyst, understanding what is financial forecasting is non-negotiable. It elevates your role from simply recording what has already happened to actively helping shape the company’s future. This is a core skill taught in courses on bookkeeping, final accounts, and business analysis.
The Strategic Importance of Forecasting
A solid forecast is much more than just numbers on a spreadsheet; it’s the company’s strategic compass. Without one, a business is essentially flying blind. It ends up reacting to problems as they appear instead of anticipating them. With an accurate forecast, leaders can plan with genuine confidence.
Here are just a few of the critical areas where forecasting makes a real impact:
- Resource Allocation: It helps leaders decide where to put their money. Should marketing get a bigger budget? Can operations afford that new equipment? The forecast provides the data to back up these decisions.
- Hiring and Staffing: By projecting future revenue and workload, a business can make smart calls on when to bring new people on board. An advanced payroll professional uses forecasts to plan for future staffing costs. This avoids being short-staffed during a rush or carrying unnecessary payroll costs during a quiet spell.
- Inventory Management: For any business selling physical products, sales forecasts are the key to managing stock. You can avoid tying up precious capital in unsold goods or, worse, losing sales because you’ve run out of a popular item.
- Securing Investment: If you’re looking for a loan or trying to attract investors, a well-researched financial forecast is your proof of credibility. It shows potential backers you have a viable, data-driven plan for growth and profitability.
A well-structured financial forecast does more than just predict numbers; it tells the story of where your business is heading and provides the roadmap to get there. It is the foundation of proactive financial management.
Ultimately, getting to grips with financial forecasting is a powerful career move. It shifts your contribution from operational bookkeeping to strategic advisory, making you an incredibly valuable asset to any UK business. This is where practical training really pays off. It equips you with the skills to analyse data, build reliable models, and deliver the kind of insights that drive real success. Training for roles like accounts assistant, business analyst, and data analyst is key to developing these skills.
Forecasting vs Budgeting: The Critical Difference

Many people use “forecasting” and “budgeting” as if they mean the same thing. In the world of accountancy, however, they serve distinct and equally vital roles. Getting this difference right is fundamental for anyone working in finance, from bookkeeping & VAT specialists to business analysts.
Think of it like planning a road trip. Your budget is the map you draw before you leave. It details your intended route, planned stops, and how much you expect to spend on fuel. It’s a static, approved plan—a financial target you aim to hit.
A financial forecast, on the other hand, is your live GPS. It updates in real-time, accounting for unexpected traffic, road closures, or that spontaneous decision to take a scenic detour. It’s a dynamic, ongoing estimate of where you’ll actually end up and when you’ll get there.
Purpose and Function
The core purpose of a budget is to set financial goals and control spending. It’s an internal benchmark that departments, and the company as a whole, are measured against. An advanced payroll specialist, for example, works within a fixed budget for staff salaries and benefits each quarter. Their training focuses on managing these costs within the planned limits.
A forecast isn’t about control; it’s about prediction and adaptation. Its job is to provide the most current view of expected financial results. This gives the business a chance to make timely adjustments. A data analyst might update the sales forecast weekly based on new market intelligence, even if the annual budget remains locked in. Data analyst courses teach how to use real-time data to make these predictions.
A budget sets expectations and measures performance against a plan. A forecast predicts future outcomes to inform strategic adjustments, ensuring the business can navigate changing conditions.
This predictive power is vital at every level, right up to the national economy. Financial forecasting in the UK has become so crucial that government tax revenue projections have reached unprecedented levels. As of 2023–24, UK tax revenue was forecast to total £950 billion. Under current plans, this is projected to rise to 37.7% of GDP by 2027–28—the highest level in the nation’s history—showing just how much prediction informs national economic management. You can explore more data on how government revenues have changed over time with the Institute for Fiscal Studies.
Flexibility and Timeframe
One of the biggest distinctions is flexibility. Budgets are typically created annually or quarterly and are meant to be rigid. Changing a budget often requires a formal approval process because it affects planned resource allocation across the entire business.
Forecasts are designed to be fluid. They are updated far more frequently—monthly, weekly, or even daily—as new information becomes available. This allows a business to react swiftly to opportunities or threats without having to formally overhaul the whole financial plan.
To make these differences crystal clear, let’s look at them side-by-side.
Financial Forecasting vs Budgeting at a Glance
This table breaks down the core distinctions between the two financial tools. While they work together, their purpose, flexibility, and focus are fundamentally different.
| Attribute | Financial Forecast | Budget |
|---|---|---|
| Purpose | To predict future performance and inform decisions. | To set financial targets and control spending. |
| Flexibility | Highly flexible and frequently updated. | Static and changed infrequently. |
| Timeframe | Can be short-term (e.g., monthly) or long-term. | Typically set for a fixed period (e.g., annually). |
| Focus | “What is likely to happen?” | “What do we want to happen?” |
Ultimately, budgeting and forecasting are two sides of the same financial management coin. The budget provides the goalposts, while the forecast tells you if your team is on track to score. Professionals skilled in both, from accounts assistants managing final accounts to business analysts interpreting data, are essential for any successful organisation. Training courses in these areas build expertise in both budgeting and forecasting.
Exploring Key Financial Forecasting Methods
To really understand what financial forecasting is, we need to look at how these predictions are actually made. The methods companies use aren’t secret formulas. They fall into two main categories, each with its own strengths. Think of it like the difference between using old maps and surveying the land yourself—both are vital for plotting a course.
At its heart, financial forecasting splits into two main approaches:
- Quantitative Forecasting: This method is all about the numbers. It leans on historical data, mathematical models, and statistical analysis to predict what’s coming. The core assumption here is that past patterns will repeat themselves.
- Qualitative Forecasting: This approach is much more about human judgement and expertise. It comes into play when historical data is thin on the ground or unreliable—like when launching a brand-new product or stepping into a completely new market.
For anyone training to be a business analyst or data analyst, mastering the quantitative side is a crucial step towards adding real strategic value.
Quantitative Methods: The Data-Driven Approach
Quantitative forecasting uses historical figures to build a mathematical picture of the future. It’s objective, consistent, and takes a lot of the guesswork out of the equation. This is where skills in Advanced Excel and data visualisation tools like Power BI become incredibly powerful. Business analyst and data analyst training heavily focuses on these tools.
You’ll come across two common quantitative techniques time and again:
- Time-Series Analysis: This is one of the most direct methods. It involves looking at past data points over a specific period—like monthly sales from the last three years—to spot trends, seasonal patterns, and cycles. Once you’ve identified these patterns, you can project them forward to estimate future performance. A bookkeeper reviewing past VAT returns could use this to forecast upcoming liabilities.
- Causal Modelling: This technique takes things a step further. Instead of just looking at what happened in the past, it tries to find a cause-and-effect relationship between different variables. For example, a business analyst might use regression analysis to figure out how much sales revenue (the effect) goes up for every pound spent on a specific marketing campaign (the cause).
These data-heavy techniques are the bedrock of modern finance roles. They transform raw numbers from accounting software like Xero or Sage into business intelligence you can act on.
Qualitative Methods: The Expert-Led Approach
Sometimes, the numbers alone just don’t tell the full story. That’s where qualitative forecasting comes in. It draws on the knowledge and gut feeling of people who understand the market inside and out. It’s subjective, for sure, but can be priceless when data is limited.
This approach often involves things like market research, expert panels, or customer surveys. Before launching a new service, for instance, a company might survey potential customers to gauge their interest and predict initial sales. It’s less about complex formulas and more about informed opinion. You might be interested in our guide on what is variance analysis to see how actual results are compared against these kinds of predictions.
While quantitative methods give you the ‘what’ based on historical data, qualitative methods often provide the ‘why’ by adding human insight and a feel for what the market will do next. The strongest forecasts usually blend both.
Evolving Methods in the UK Economy
The world of financial forecasting isn’t standing still. In the UK, forecasting techniques have evolved to include a mix of methods tailored to specific market behaviours. For instance, some approaches now use techniques like the S-curve function and exponential trend smoothing. These are perfect for forecasting sectors with non-linear growth, like digital financial services. Key drivers in modern UK forecasting include GDP per capita, the level of digitisation, and consumer attitudes towards financial apps. You can explore more on Statista about the UK’s financial app market.
This constant evolution shows why continuous professional development is so important. Roles like an accounts assistant or advanced payroll specialist are increasingly expected to grasp the basics of these methods. For business and data analysts, a deep knowledge of both quantitative and qualitative techniques is essential for creating the accurate and reliable forecasts that guide major business decisions.
How to Build Your First Financial Forecast
Okay, we’ve covered the what and the why. Now, let’s roll up our sleeves and get practical. Building your first financial forecast might feel like a huge task. But it’s really just a logical process that uses data you probably already have. This guide is designed for anyone stepping into a trainee bookkeeper or accounts assistant role, giving you a clear blueprint to follow.
The whole thing starts not with numbers, but with a simple question: what is this forecast actually for? Are you trying to see next quarter’s cash flow to make sure you can pay suppliers on time? Or maybe you need to project the full year’s revenue to justify hiring a new team member. Getting this objective clear from the start is the most important step. It dictates your timeframe, the level of detail you’ll need, and what data to focus on.
For example, a short-term cash flow forecast will zoom in on accounts receivable and payable. On the other hand, a long-term sales forecast needs a wider lens, looking at market trends and the sales pipeline. Nail this down first, and you won’t get lost in a sea of irrelevant numbers later on.
Gather Your Historical Data
Your best guide to the future is what’s already happened. This is where your bookkeeping and accounting software becomes your best friend. You’ll need to pull up your historical financial statements—specifically the Profit and Loss (P&L) and the Cash Flow statement—from platforms like Sage, Xero, or QuickBooks. Bookkeeping and final accounts courses train you to prepare and interpret these statements accurately.
Try to get at least two or three years of monthly data if you can. This depth is what lets you spot the important patterns:
- Seasonality: Does revenue always spike around Christmas?
- Trends: Are your operating costs creeping up year after year?
- Anomalies: Was there a big, one-off expense last year that you shouldn’t expect to see again?
This historical data is the bedrock of your forecast. In the UK, this practice has deep roots; forecasters can pull from an incredible amount of information. The Office for Budget Responsibility and the Bank of England keep databases with hundreds of years of economic data. This just goes to show how vital historical context is. As research shows, this deep data helps us understand long-term economic patterns. You can explore how historical data helps with predictability in this detailed study on long-term inflation.
Identify Your Key Business Drivers
Once you have your data, it’s time to figure out your key business drivers, or assumptions. These are the specific things that have the biggest impact on your financial results. At the end of the day, a forecast is only as solid as the assumptions it’s built on.
Think of business drivers as the levers you can pull or the external forces you have to react to. Identifying them is what turns your forecast from a simple maths exercise into a proper strategic tool.
Common drivers usually include:
- Sales Volume: The number of units you sell or new customers you sign up each month.
- Pricing: The average price tag on your products or services.
- Cost of Goods Sold (COGS): The direct costs of making what you sell.
- Operating Expenses: Fixed costs like rent and salaries, plus variable costs like your marketing budget.
For a new accounts assistant, a great way to start is to go through the P&L statement line by line and ask, “What makes this number go up or down?” This simple question helps you build a model that’s much more dynamic and closer to reality.
Create, Review, and Refine Your Forecast
With your data and assumptions sorted, you can start building the model. This usually begins in a simple spreadsheet. Lay out your historical data month by month, then add columns for your future forecast period. Project your revenue using your sales drivers, and then do the same for your expenses.
But your first go isn’t the final version—it’s just a draft. The most important final steps are to review and refine it. Share it with the heads of other departments. The sales manager will have brilliant insights into the sales pipeline, and the operations team will know if any costs are about to change. This kind of collaboration makes sure your forecast is anchored in what’s actually happening in the business. It turns it into a much more powerful tool for making decisions.
Essential Tools and Software for Modern Forecasting
A forecast is only as good as the tools you use to build it. While the methods give you a strategy, it’s the software that brings your predictions to life. For anyone working in bookkeeping, payroll, or business analysis, getting comfortable with these platforms is how you turn raw data into a reliable look at the future.
The undisputed champion and the starting point for almost any forecast is Microsoft Excel. It’s the workhorse of the finance world for a reason. Its sheer flexibility lets you build bespoke models from scratch, run complex what-if scenarios, and perform the kind of deep-dive analysis that off-the-shelf software often can’t touch.
With advanced Excel training, you unlock the functions that are the bedrock of forecasting, like PivotTables for slicing and dicing huge datasets, or goal-seeking to work backwards from a target. It’s the digital canvas where your forecast is truly born.
The Foundation: Your Accounting Software
Before you can build anything in Excel, you need clean, reliable historical data. That foundational information comes straight from your company’s accounting software. Platforms like Xero, Sage, and QuickBooks are the single source of truth for every penny that moves through the business.
These systems log every transaction—from sales invoices to supplier payments—giving you the rich dataset needed for both time-series and causal analysis. The meticulous work of an accounts assistant in keeping these records spotless is the first, and most critical, step in the whole forecasting process. You can learn more about the top software tools we teach in our bookkeeping & VAT course and see how they create this data foundation.
The process is quite straightforward when you break it down. You start with the raw data, build your model, and then refine it.
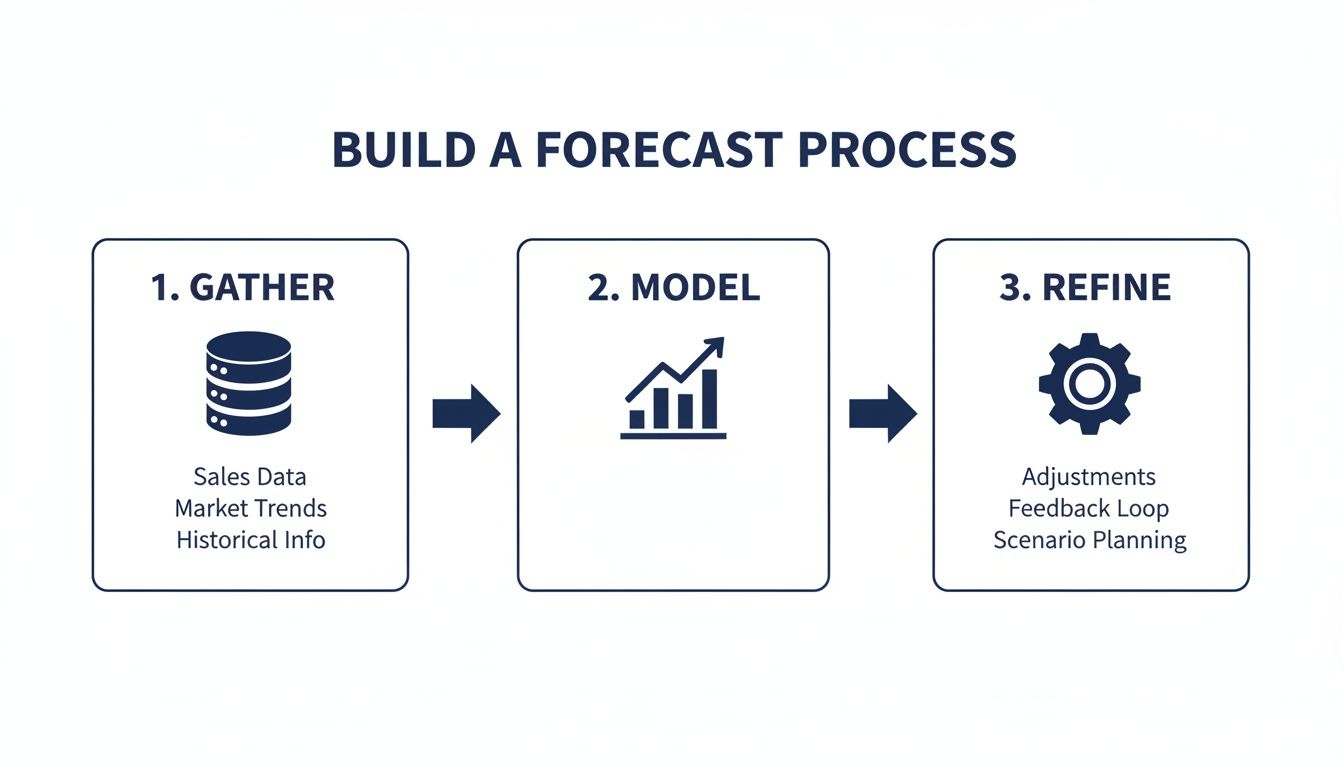
This visual shows how the clean data from accounting systems feeds directly into your model. This model is then adjusted with real-world knowledge to create a forecast you can actually rely on.
The Next Level for Analysts
As you move into more analytical roles, your toolkit needs to expand. Business analysts and data analysts require more powerful tools to wrestle with much larger datasets and pull out deeper insights. They connect technology directly to big strategic decisions.
Here are some of the key platforms you’ll encounter:
- SQL (Structured Query Language): Think of this as the language you use to talk to databases. Analysts use SQL to pull specific, custom-built datasets from massive company databases. It lets them get the exact information they need for a model without having to manually filter through endless reports.
- Power BI: This is Microsoft’s business analytics tool, and it’s a master at data visualisation. An analyst can hook Power BI up to various data sources (like an Excel model or a SQL database) to create interactive dashboards. This allows bosses and colleagues to play with the forecast, filter by different variables, and see the key drivers for themselves.
While Excel is often where a forecast is built, tools like SQL and Power BI are what make it dynamic, scalable, and easy for the entire business to understand. They bridge the gap between a spreadsheet full of numbers and a plan of action.
For anyone looking to move into more advanced data analytics, exploring various Business Intelligence tools can seriously upgrade your forecasting abilities. Gaining proficiency in these tools through dedicated training for data analysts and business analysts is a direct path to higher-level roles. You’ll be shaping the company’s future, not just reporting on its past.
Developing Your Forecasting Skills for the UK Job Market
Knowing what financial forecasting is and understanding the tools is just the starting point. The real challenge is turning that knowledge into practical, job-ready skills that UK employers are looking for right now. To truly stand out, you need a powerful mix of analytical thinking, software skills, and genuine business insight.
This is where targeted, career-focused training comes in. It bridges the gap between textbook theory and the day-to-day realities of a finance role. Whether you’re aiming to become an Accounts Assistant, a Business Analyst, or a Data Analyst, it’s the hands-on experience that makes all the difference.
Building Your Competence with Practical Training
Generic knowledge simply isn’t enough to land your next role. Employers need to see that you can apply forecasting principles using the software they rely on every day. Training in bookkeeping, advanced payroll, and preparing final accounts gives you a solid grasp of the data that fuels every single forecast.
When you work directly with platforms like Xero, Sage, and QuickBooks, you learn more than just how to record financial information. You learn how to pull it out for proper analysis. This practical application builds the muscle memory you need to confidently handle the data-gathering stage of any forecasting project.
The most effective way to learn financial forecasting is by doing it. One-to-one training with ACCA qualified accountants provides personalised guidance, allowing you to build real models and solve practical problems in a supportive environment.
This hands-on approach builds both competence and confidence. When you can walk an interviewer through a forecasting model you’ve built yourself, it proves a level of understanding that a certificate alone just can’t.
From Core Accounting to Advanced Analytics
As your career goals expand, your skillset needs to keep pace. An Accounts Assistant might focus on gathering accurate historical data. But a Business or Data Analyst is expected to build sophisticated predictive models. This is where training in advanced software becomes a game-changer.
- Accounts Assistant & Bookkeeping: Mastering these roles means providing clean, accurate data—the essential ingredient for any reliable forecast. Training ensures you understand the nuances of VAT and payroll, which are critical inputs for preparing final accounts.
- Business & Data Analyst: For these positions, you need to go further. Learning Advanced Excel, SQL, and Power BI allows you to analyse vast datasets, identify key business drivers, and present your findings in compelling, interactive dashboards that guide strategic decisions.
To truly excel in financial forecasting, consider building on your foundational knowledge with relevant online accounting courses. This broadens your understanding of core principles, making your specialised skills even more valuable.
Ultimately, this kind of training is a direct path to getting hired in the UK finance industry. It gives you the exact blend of theoretical knowledge and practical software skills that employers are searching for. By investing in your abilities, you aren’t just learning—you are actively preparing to secure your next role. For more insights, you might be interested in the key financial analyst skills needed to succeed.
Your Financial Forecasting Questions Answered
As you start to get your head around financial forecasting, a few questions always seem to pop up. It’s completely normal. This final section tackles some of the most common queries we hear from trainees, giving you clear, straightforward answers to help lock in your understanding.
How Often Should a Business Update Its Financial Forecast?
There’s no single right answer here—the perfect frequency really depends on the company’s industry, its size, and how fast things change in its market. However, a good rule of thumb for most businesses is a monthly review and update.
This monthly check-in gives the business a chance to react to the latest sales figures, account for any surprise costs, and generally stay on its toes. For businesses in a really fast-paced environment, like a retail company gearing up for the Christmas rush, even weekly updates might be needed to keep a handle on stock and staffing.
Think of your forecast as a living document, not a static report you file away. The more volatile your business environment, the more often you need to refresh it. This ensures your decisions are always based on the most current information you have.
What’s the Difference Between Top-Down and Bottom-Up Forecasting?
These two terms describe opposite ways of building a forecast, and each has its place.
-
Top-Down Forecasting: This method starts from the 30,000-foot view. It begins with a big-picture market projection (like the total size of the UK software market) and then works down to estimate the company’s likely slice of that pie. It’s a quick approach, often used by senior leaders for high-level strategic planning.
-
Bottom-Up Forecasting: This approach is the complete opposite—it starts from the ground up. It involves collecting detailed predictions from individual departments or teams (for example, what each salesperson realistically thinks they can sell) and then adding them all up. This method is far more detailed and usually more accurate because it’s built on granular, real-world operational data.
Can AI Be Used in Financial Forecasting?
Yes, and it’s happening more and more. Using Artificial Intelligence (AI) is quickly becoming standard practice in modern financial forecasting, especially in larger companies that have huge amounts of data to sift through. AI can analyse massive datasets far quicker and more accurately than any human. It can spot subtle patterns and connections that would easily be missed.
AI-powered tools can make a huge difference to forecast accuracy, especially in tricky areas like cash flow. By analysing real-time data on things like customer payment habits and market shifts, AI helps businesses see financial gaps and opportunities coming much sooner. Given that poor cash flow management is a factor in 82% of business failures, AI forecasting is a powerful tool for managing that risk.
What Are the Most Common Mistakes to Avoid When Creating a Forecast?
Building a reliable forecast is as much about avoiding common traps as it is about getting the numbers right. One of the biggest mistakes is being wildly optimistic or pessimistic—letting personal bias get in the way of the data. Another is relying only on historical data without thinking about what might change in the future. Always remember: the past is a guide, not a guarantee.
Finally, a classic error is failing to involve other departments. When a forecast is created in a finance silo, it’s often disconnected from what’s actually happening on the ground in sales, marketing, or operations.
Ready to build the practical skills that will launch your career in accountancy and finance? At Professional Careers Training, we provide one-to-one, hands-on training with ACCA qualified accountants to ensure you master the software and techniques UK employers demand. Explore our courses and start your journey today.

